3.2. Grid Lines
Grid lines are similar to the lines on graph paper. They allow the user to easily align objects on the canvas. The grid lines can be temporarily hidden for the current document by selecting → .
Grid line properties can be modified by selecting → , which brings up the dialog shown in the figure below.
Figure 3.1. Diagram / Properties / Grid
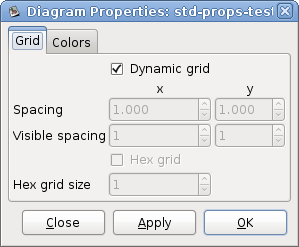
If the Dynamic grid box is checked, the grid adjusts automatically
to keep the same visible spacing as the diagram view is zoomed in or out. Also,
when this box is checked, the other options on the dialog are disabled.
If the Dynamic grid box is unchecked, then the grid spacing remains the same in absolute terms. So when the view is zoomed out, the grid appears smaller, and when the view is zoomed in, the grid appears larger.
The Spacing for the x and y coordinates is in centimeters and can be typed or entered using the increment / decrement buttons. The visible spacing determines which grid lines are visible. A value of 1 indicates that all grid lines are visible, 2 indicates that every second line is visible, and so on. Note that the snap-to-grid works the same whether or not grid lines are visible.
The Hex grid checkbox allows you to create a grid of hexagons instead of squares. The Hex grid size is also in centimeters.
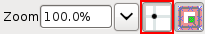
The snap-to-grid feature may be toggled on and off using the snap-to-grid button located below the canvas. When this is enabled, objects are forced to align on a grid line.
Figure 3.2. Snap-To-Grid Toggle Button